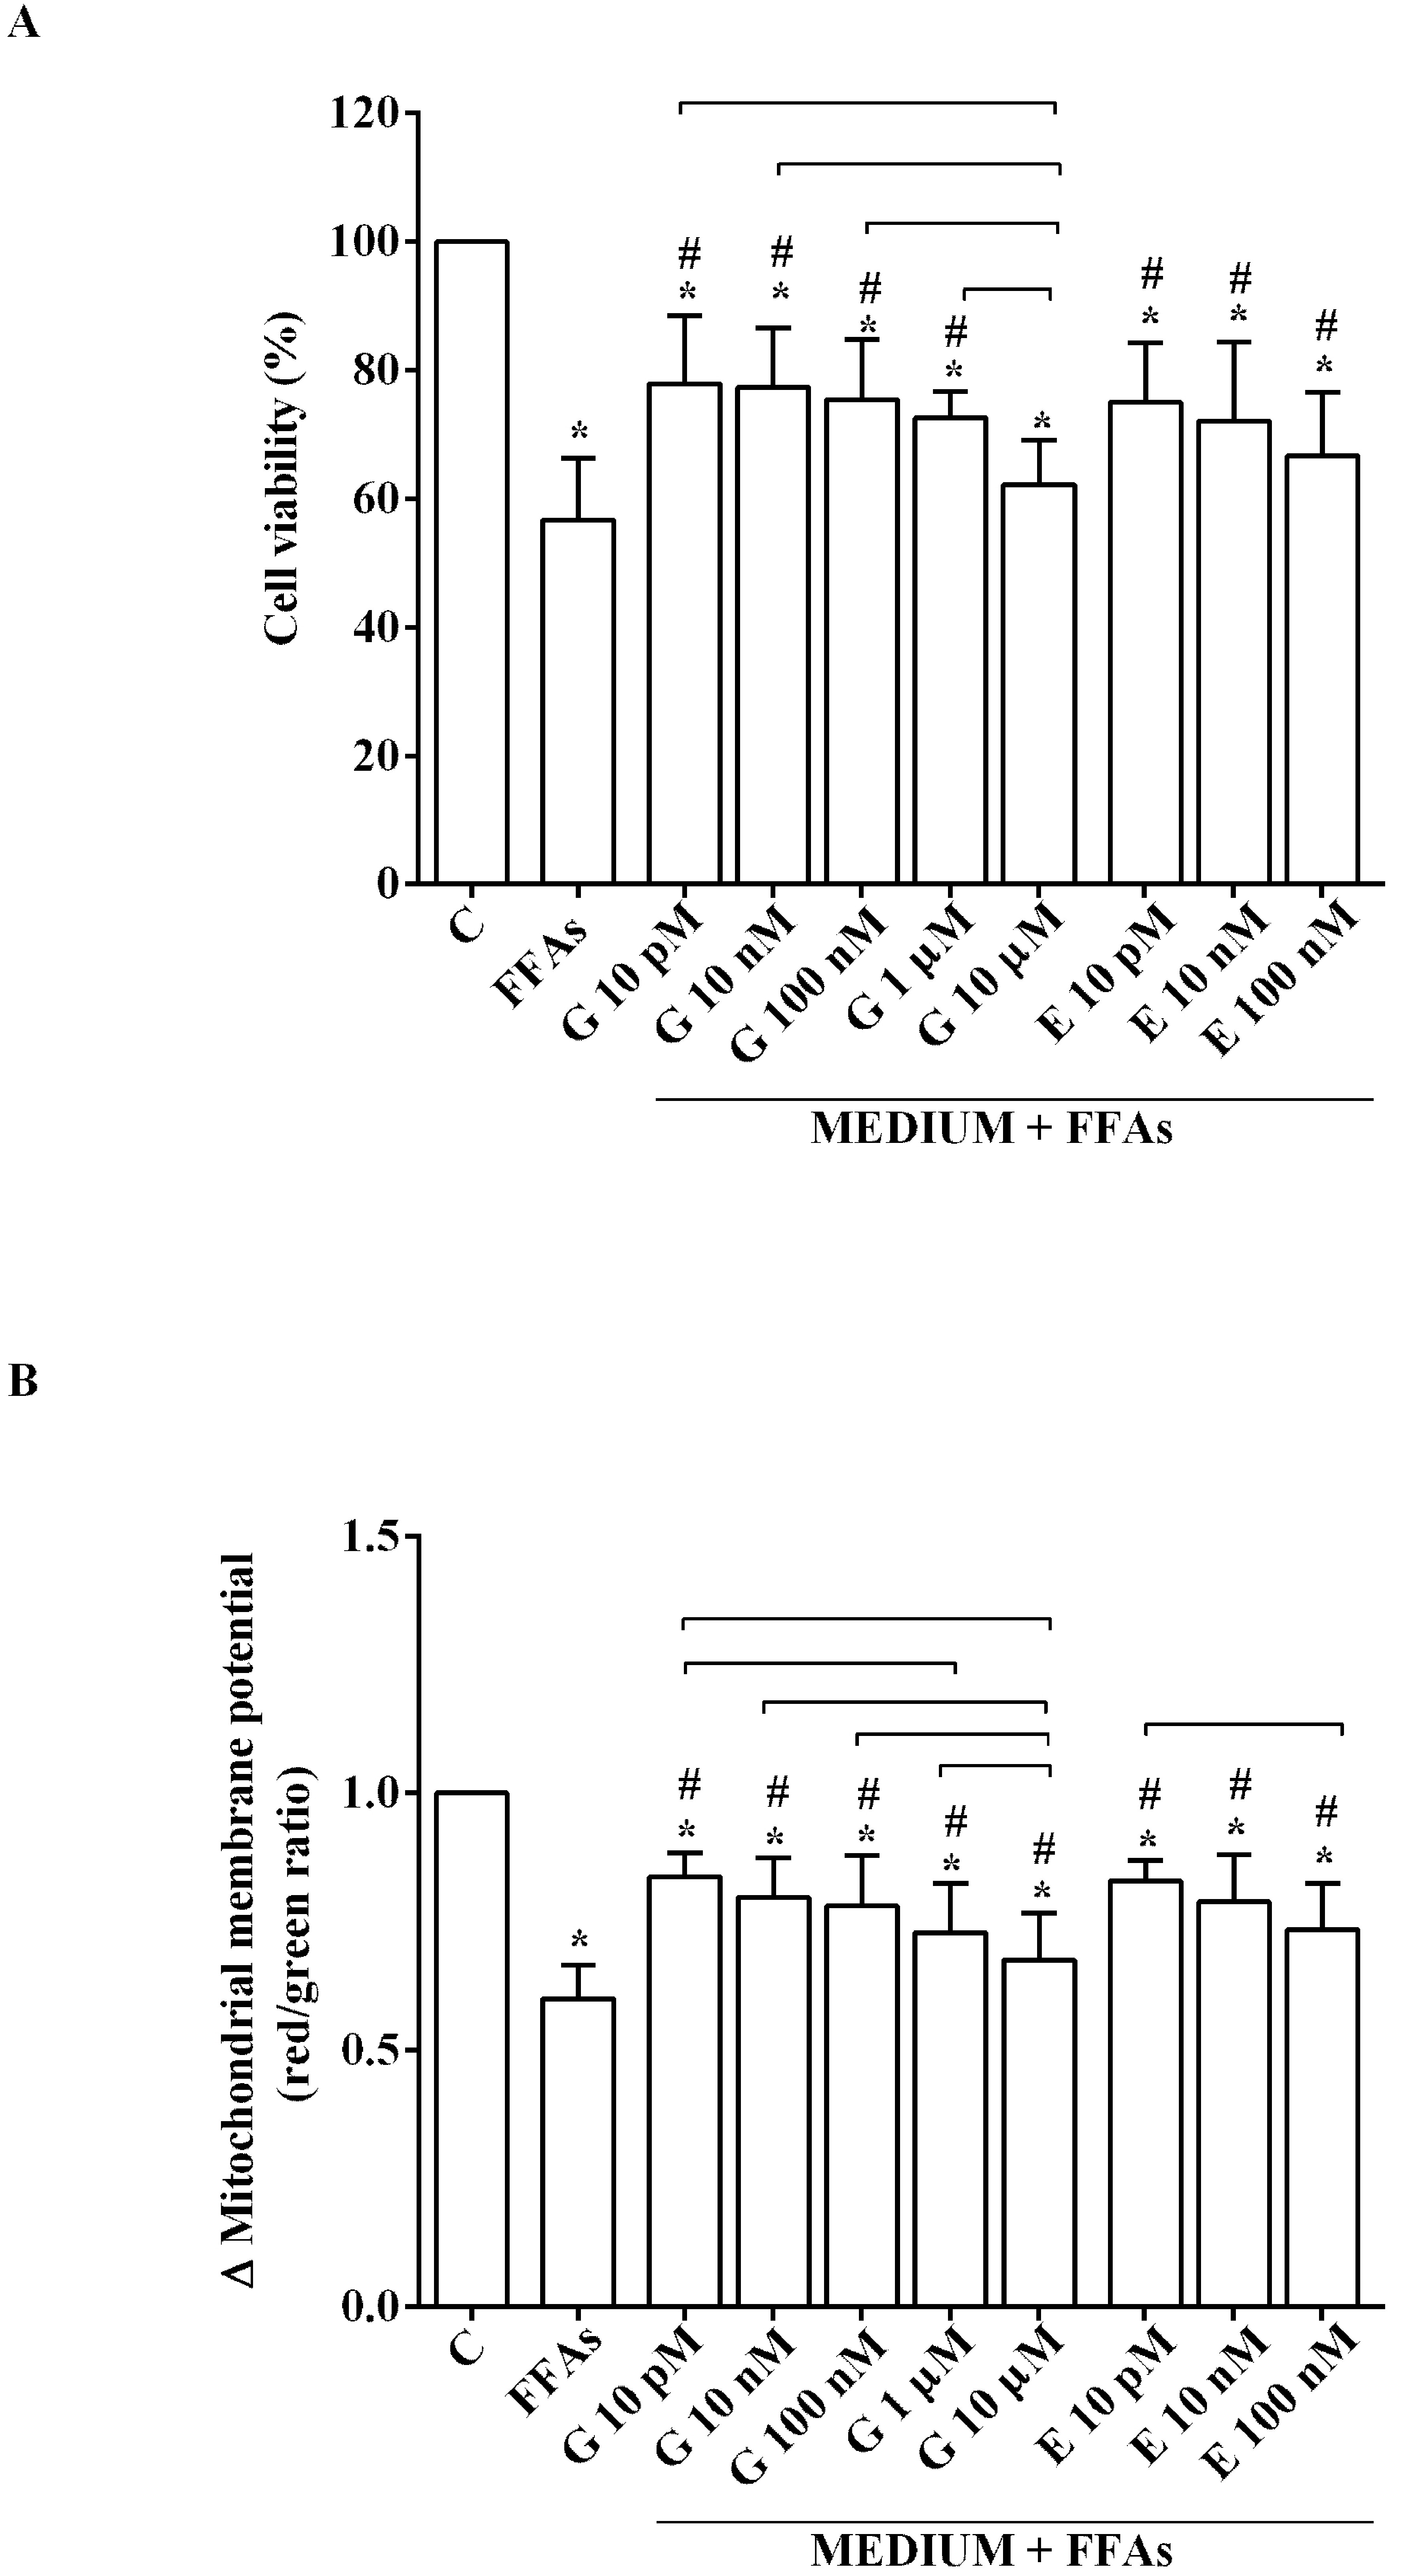
Fig. 2. Effects of genistein and 17β-estradiol on cell viability (A) and mitochondrial membrane potential (B) in Huh7.5 cells. In A and B, the effects of genistein (G) and 17β-estradiol (E), are shown. Data were normalized versus related control values. C=control (non-treated cells); FFAs=free fatty acids (2 mM for 3 h). Reported data are means ± SD of five independent experiments for each protocol. Significance between groups: *P<0.05 vs. C; # P <0.05 vs FFAs. Short square brackets indicate significance between groups (P<0.05).